Back

Topic

[KB1107]Dashboard Workaround For WebVue

Tags: Dashboard, Webvue

4 years ago
By AT
Options
Print
Applies to:

PcVue 12.0.20 onwards


Summary:

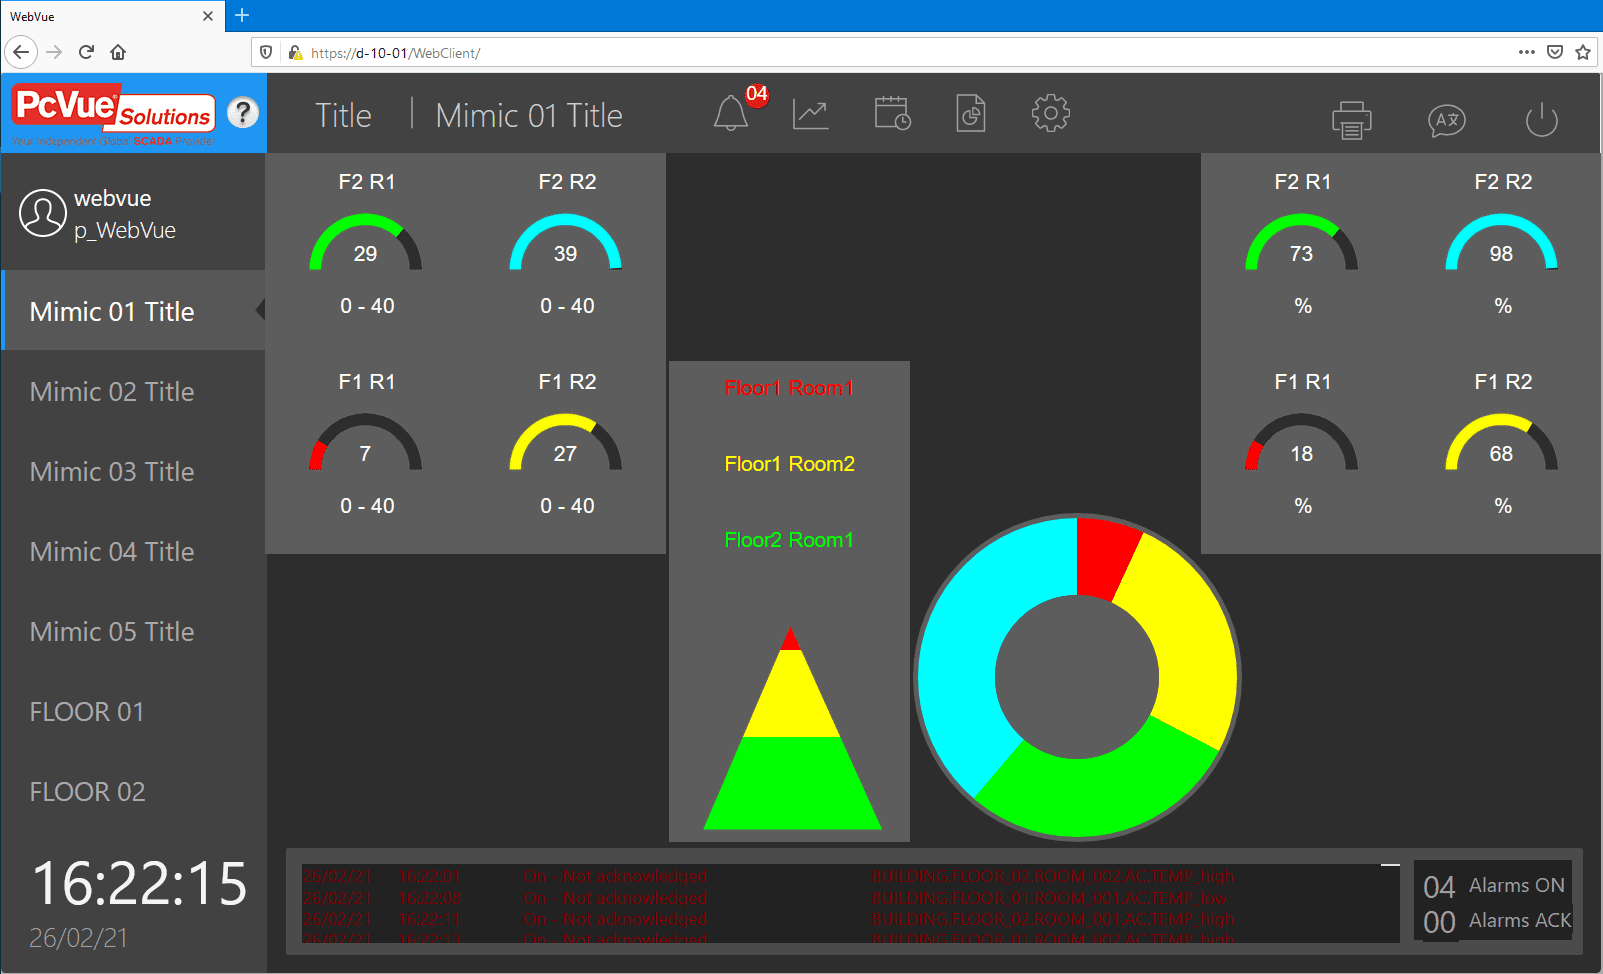
Customer demands for Dashboard mimics are increasing. As such, this article provides a workaround by using animations and SCADA Basic to mimic the behaviour of the chart controls (Pie and Pyramid) with some limitations.

A documentation, a local library and a sample project are provided for reference.


Details:

Here below description of the solution.

  1. In the sample project, these values are simulated and represent temperatures.

WebVue Dashboard sample

  1. Temperatures will then be processed in a SCADA Basic procedure which is launched periodically using a Cyclic.
  2. Then, the output information will be stored in internal register variables.
    1. Pie Chart requires the following variables:
      1. DIV_1
      2. DIV_2
      3. DIV_3
      4. DIV_4
      5. VAR_1
      6. VAR_2
      7. VAR_3
      8. VAR_4
    2. Pyramid Chart requires the following variables:
      1. COL_1
      2. COL_2
      3. COL_3
      4. DIV_1
      5. DIV_2
      6. DIV_3
      7. VAR_1
      8. VAR_2
      9. VAR_3
    3. Display Meter would require the following variables:
      1. LIM
      2. VAR

In the library provided, the symbol for Pie Chart, Pyramid Chart and Display Chart, has limitations :

  1. Pie Chart can only have a minimum of 1 variable and a maximum of 4 variables.
  2. Pyramid Chart can only have a minimum of 2 variables and a maximum of 3 variables.
  3. Display Meter only shows a single variable.
  4. Even if the maximum number of variables is not used, user must create all internal variable(s) and initialize the unsused ones to 0.

Download Files:

  1. Project Zip File
  2. Local library
  3. Library Documentation

Created on: 14 Feb 2021 Last update: 30 May 2024